
For legitimate business websites, Google’s September 2026 spam update was close to a non-event. That’s what we found at TJ Digital, my agency, when we compared how our client sites did before and after it.
We help businesses show up in Google and in AI search. As of October 2026, we have about 100 websites in our Google Search Console, so we can see each site’s search data straight from Google. We create content for almost every one of them, and 100% of the content we create is drafted by AI.
That made our clients a useful test, because a lot of people assumed this update was aimed at AI-generated content. Google says it doesn’t care how content is created as long as it’s high quality, but Google says a lot of things, and people don’t always believe them.
Once the update finished, I gave the data to Opus 5.5, Anthropic’s AI model, on its max setting. It compared each site’s clicks in the 11 days before the update with the 11 days after it. Search traffic shifts at this time of year anyway, so it also compared that change with each site’s change over the same weeks last year, which I’ll call last year’s pattern.
Against last year’s pattern, the typical site ended with about 6% fewer clicks. That’s a small gap, and fewer of our sites saw big swings this year than over the same weeks last year. Rankings also moved less after the update than in the weeks just before it, when no update was running. Where clicks did drop, it was mostly because fewer people were searching.
What was the September 2026 spam update?
The September 2026 spam update ran from September 24 to October 8, 2026, which is 13 days and 16 hours. That’s far longer than Google’s other three spam updates this year, none of which took more than three days. When Google released it, it said only that the update “applies globally and to all languages.”
Google never said what this update targeted. In a LinkedIn post quoted by Search Engine Roundtable, it called it “a normal spam update,” and it named no spam policy, no share of searches affected and no reason for the longer rollout. Our earlier post on the update covers what spam updates are and why Google has run so many of them this year.
What did SEOs report during the rollout?
The reports during the rollout made the update sound much worse than what we saw. Lily Ray, quoted by Search Engine Roundtable, saw early signs it was hitting sites with “highly templated, programmatic, (probably) AI-generated pages,” such as one page for every phone number or area code. Glenn Gabe said he was seeing big drops across a number of sites, in different industries and countries.
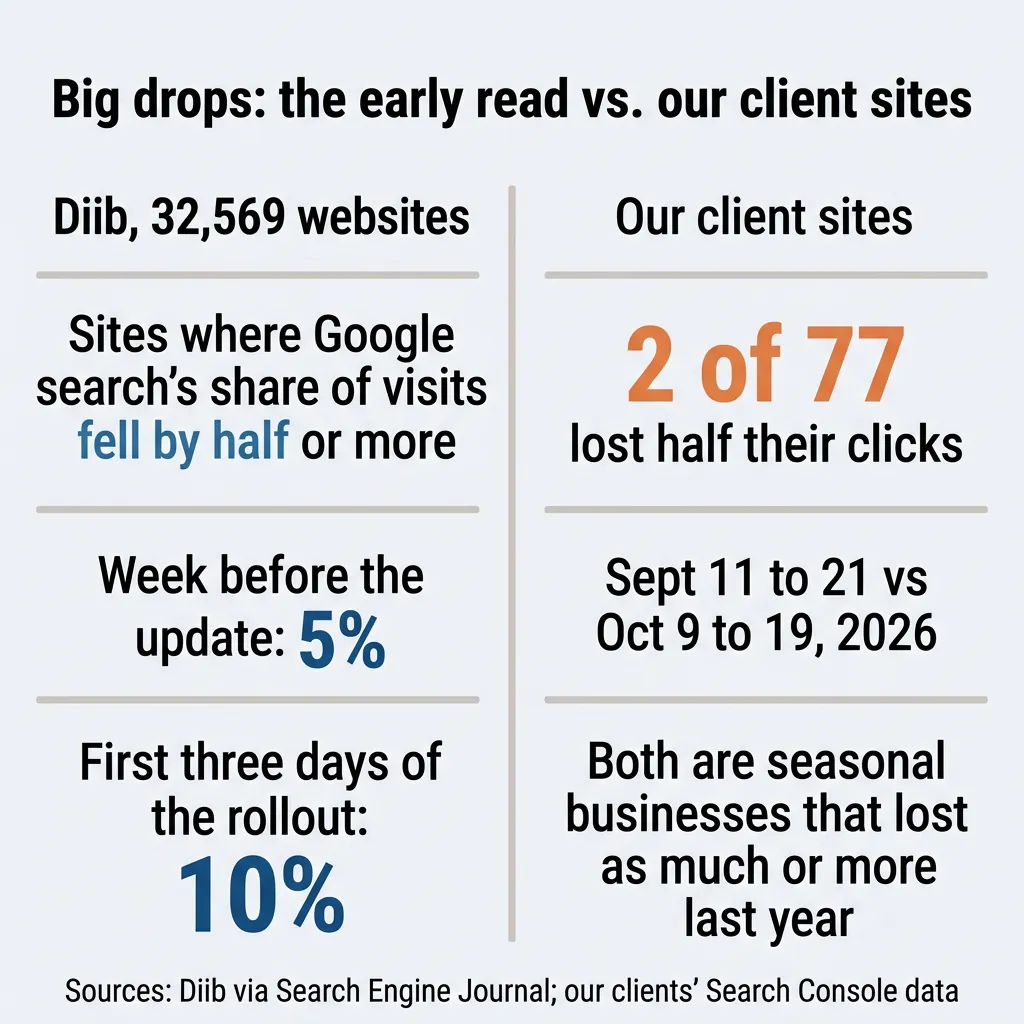
The one large dataset came from Diib, which looked at 32,569 websites and tracked the share of each site’s visits that came from unpaid Google search. In the first three days of the rollout, 10% of sites saw that share fall by half or more. Over the same three days a week earlier, 5% did, so the rate doubled (Search Engine Journal). Diib called the result “an early read, not a verdict.”
How did we measure the update’s impact?
We compared each client site’s Search Console data from the 11 days before the update with the 11 days after it finished. We skipped the two weeks of the rollout itself, because rankings can shift around while an update is still rolling out. Both windows run Friday to Monday, so they have the same mix of weekdays.
| Comparison | Dates | What it tells us |
| Before the update | Sept 11 to 21, 2026 | The baseline |
| After the update | Oct 9 to 19, 2026 | The result |
| Last year’s pattern | Sept 12 to 22 vs Oct 10 to 20, 2025 | How much clicks normally change at this time of year |
| Control weeks | Aug 28 to Sept 7 vs Sept 11 to 21, 2026 | How much rankings move when no update is running |
We started with 107 sites, and 100 had usable data. The click figures use the 77 sites with at least 30 clicks in the before window. The comparison with last year’s pattern uses the 60 of those that also had at least 30 clicks over the same weeks of 2025.
How much traffic did sites lose in the September spam update?
Across the 60 sites with enough traffic in both years, the typical client site ended with about 6% fewer clicks than last year’s pattern. Against that pattern, the middle half of those 60 sites landed somewhere between 19% down and 12% up.
That 6% gap is small next to how much our sites usually swing at this time of year. Fewer sites saw big swings in clicks this year than over the same weeks last year:
| The 60 sites with a 2025 baseline | Same weeks of 2025 | This year |
| Sites whose clicks moved 20% or more, up or down | 48% | 32% |
| Median swing in clicks, up or down | 19% | 15% |
No site collapsed. Of the 77 sites with 30+ clicks, only two lost half their clicks, and both are seasonal businesses that lost as much or more over the same weeks last year.
Did rankings drop after the spam update?
Across the update, more pages dropped and fewer pages rose than in the control weeks before it, and the total amount of movement went down. On the median site, the share of pages that dropped three or more positions went from 3% to 13%, and the share that rose three or more positions went from 29% to 11%. Overall, 27% of pages moved three or more positions in either direction, against 35% in the control weeks, and the average position barely changed.
| Page ranking movement | Control weeks (Aug 28 to Sept 7 vs Sept 11 to 21) | Across the update (Sept 11 to 21 vs Oct 9 to 19) |
| Pages that moved 3+ positions (median site) | 35% | 27% |
| Pages that rose 3+ positions | 29% | 11% |
| Pages that dropped 3+ positions | 3% | 13% |
| Average position change (median site) | 1.3 positions better | 0.1 positions worse |
Each row is its own median across sites, so the rises and drops don’t add up to the total that moved. The figures cover 71 sites, counting pages with at least 50 impressions in both windows.
Why are clicks down if rankings held?
Clicks fell mostly because fewer people searched. We looked at the searches where a site’s ranking stayed within one position across the update, and on those searches, the median site still lost clicks:
| Searches where the ranking held (median site) | Change |
| Clicks | -12% |
| Impressions | -8% |
| Click-through rate | -1.7% |
Each figure is a median across sites, so they don’t add up exactly. Together, they show that fewer people searched: the sites showed up less often at the same positions, and when they did show up, people clicked on them at about the same rate as before.
Branded searches, meaning searches for a business’s own name, dropped about as much as everything else. A site usually keeps ranking for its own name, so fewer branded clicks means fewer people searched for the business. The median site lost 11% of its branded clicks and 12% of its non-branded clicks, and because the two dropped by about the same amount, the non-branded drop looks like the same drop in demand.
The slide also started before the update. Across our sites, daily impressions were already drifting down in early September and kept falling at about the same pace through the rollout, then leveled off. There’s no sudden drop on September 24.
Did the September spam update hit AI content?
Nothing in our data looks like a penalty for AI-drafted content. All the content we create for clients is drafted by AI and reviewed by people, and those sites moved no more than they did over the same weeks last year.
The pages we created did better than that. The 287 pages we’ve published or updated for clients since August 28 went from 1,059 clicks before the update to 1,302 after it, a 23% increase. The brand-new pages among them nearly doubled, from 306 clicks to 571.
Google’s own definition of spam doesn’t single out AI. Its spam policies say scaled content abuse “is when many pages are generated for the primary purpose of manipulating search rankings and not helping users,” and that the policy applies “no matter how it’s created.” Google’s 2023 guidance on AI content makes the same point: “Using AI doesn’t give content any special gains. It’s just content.”
As I see it, Google has a real problem right now: billions of low-quality pages created by AI are flooding the internet. Most of them add little or no value, and a lot of them exist to manipulate search results. Those pages are what Google is fighting.
Google also added a line to its guidance on AI-generated content on October 1, in the middle of the rollout, telling publishers to fact-check and review AI content before publishing it. I covered that change separately.
None of this means you should flood your site with AI content. Our clients are legitimate businesses, and we create high-quality content that each brand is proud to put on its website.
Did templated location pages get hit?
Our templated landing pages came through fine, even though they’re the kind of page the early reports said the update was hitting. We counted a page as templated when it’s a landing page in the same section of the site’s URLs as 15 or more similar pages: location pages, program pages and real estate community pages.
To see how a group of pages did, we compared its change with the change for the rest of the same site. That cancels out anything that moved the whole site, such as the time of year or a change in brand searches.
By that measure, our templated pages went from slightly behind the rest of their site to slightly ahead of it. In the control weeks, their impressions trailed the rest of their site’s by 4%, and after the update they ran 2% ahead (39 sites). On clicks, they matched the rest of their sites almost exactly (0.1% ahead, across 26 sites).
The difference between our templates and the kind of templated pages the early reports pointed to is probably what’s on the page. Ours describe real programs, real listings and real locations, rather than repeating one page with a different place name swapped in.
Which pages and searches gained or lost ground?
Measured the same way, against the rest of their own site, most types of pages and searches moved less than 7%. These four patterns stood out:
- Category and collection pages gained visibility. They gained 13% in impressions relative to the rest of their site, with gains on 12 of the 15 ecommerce sites that had enough data on these pages, after being flat in the control weeks. Clicks haven’t followed yet: across the 10 sites with enough clicks to measure, they were down 7% relative to the rest of the site.
- The longer the search, the worse it did. One- and two-word searches did 5% better than the rest of their site, while searches of eight or more words did 7% worse. That fits a world where long, conversational questions increasingly go to AI answers instead of a results page.
- “Near me” searches slipped. They lost 11% of impressions against the rest of their sites, across 38 sites.
- Product pages trailed, but the update didn’t cause it. They ran 7% behind the rest of their sites, exactly the same gap they had in the control weeks before the update started.
The search-length and “near me” figures come from query data that starts September 11, so there’s no control period to compare them with. They show what changed around the update, and they can’t prove the update caused it.
When did sites move during the rollout?
Most of the real changes we saw landed late in the rollout, between October 2 and 8, rather than on the first weekend, when the early reports came in.
| Site | What happened | When | Change |
| An ecommerce brand | Flat, then climbed and held. Brand searches and product landing pages both rose. | Climbed Oct 2 to 8 | Clicks up 37%, up 45% against last year’s pattern |
| A law firm | Its legal explainer posts climbed, and one post’s clicks grew about tenfold. | Steady climb, Sept 23 to Oct 14 | Clicks up 31%, up 35% against last year’s pattern |
| Another ecommerce store | Jumped about 40% mid-rollout, then fell back to normal. | Up Sept 29 to Oct 5, back near normal by Oct 14 | Clicks down 1% |
| A local service business | Its top guide slipped from position 2.7 to 5.4. | After Oct 8 | Clicks down 40% |
Anyone who judged the update on October 3 would have called it a big win for the second ecommerce store, and the gain was mostly gone ten days later. The local service business’s drop started after the rollout ended, so it may not be the update at all.
How did different types of businesses do?
No type of business was hit across the board. Ecommerce did best against last year’s pattern, and local service did worst.
| Business model | Sites | Median click change | Median change against last year’s pattern (sites compared) |
| Ecommerce | 19 | -8% | +4% (16) |
| SaaS and apps | 9 | 0% | -9% (8) |
| National lead generation | 12 | -15% | -8% (9) |
| Local service | 34 | -11% | -11% (24) |
- Ecommerce: 10 of 16 stores did better than last year’s pattern. The biggest ecommerce loser was down 17%, after two of its bigger category pages slipped about three positions.
- Local service: these sites were down about 11% in clicks, and about 11% against last year’s pattern too, so the time of year doesn’t explain their drop. Together with the slide in “near me” searches, that makes local the group to watch, but it isn’t a clear hit.
- Legal: our law firm clients were split. One firm’s explainer posts climbed during the rollout, three firms lost between 14% and 33% (two of them small sites), and two more lost about 11%.
How do I know if my traffic drop is from the spam update?
Check your rankings before you react to your traffic percentages. These are the checks we ran on our clients, and you can run the same ones in Search Console:
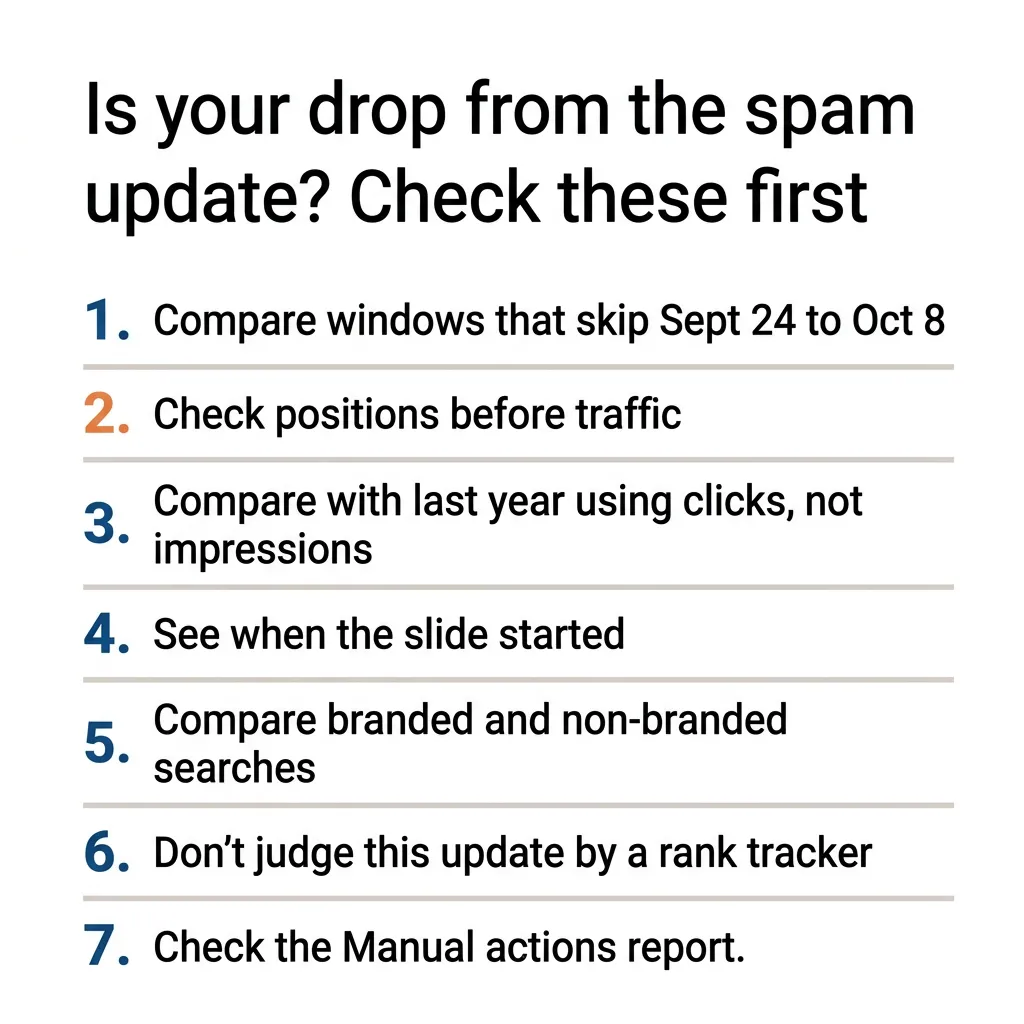
- Compare windows that skip the rollout. The update ran from September 24 to October 8, so compare the days after October 8 with the same number of days before September 24, matching the weekdays. Judge it on more than a few days of data.
- Look at positions first. In Search Console’s Performance report, check average position for your main pages and queries (our guide to reading Search Console data walks through the report). If positions held and impressions fell, fewer people were searching, and Google’s view of your site didn’t change.
- Compare with the same weeks last year, using clicks. Google says a logging error affected impressions in Search Console starting May 13, 2025, and clicks weren’t affected. Last year’s impressions aren’t a fair comparison, but last year’s clicks are.
- Check when the slide started. Look at daily clicks and impressions from August on. If the decline was already under way before September 24, the update didn’t start it.
- Compare branded and non-branded searches. If clicks on searches for your company’s name fell as hard as everything else, fewer people are searching.
- Don’t judge this update by a rank tracker. SEOmonitor found that since September, rank trackers have often shown ranking changes that searchers didn’t see, because Google tends to return incomplete and incorrect results to automated searches. It says real spam-update changes typically persist across days and appear in Search Console.
- Check the Manual actions report in Search Console. A manual action is a penalty that a person at Google applies by hand, separate from the automated spam update. Marie Haynes, an SEO consultant who helps sites with manual actions, said the requests she gets from site owners for that help “went from essentially no requests to several per week” this autumn.
If the update did hit your site, the fix is to bring it in line with Google’s spam policies. Google says making changes “may help” a site improve if its automated systems learn “over a period of months” that the site complies, so it promises no recovery and no fixed timeline. Our post on what gets sites penalized covers what to look at.
What are the limits of this data?
Our data comes from legitimate businesses we’re actively doing SEO for. Their sites publish real content, which makes them exactly the kind of site a spam update shouldn’t touch. So the data shows that the update spared sites like ours, and it can’t tell you whether the update was weak overall.
A few other limits are worth knowing:
- Our own work is in the numbers. The new and updated pages we published for clients are part of the totals, so they lift the after-window click counts a little.
- The comparison with last year’s pattern covers 60 sites. A site’s 2025 numbers carry their own noise, such as redesigns, migrations and campaigns starting.
- We have 11 days of after data. Google’s spam systems run all the time, so a site could still move.
- The timing of a change doesn’t prove what caused it. Nothing in the data says which changes Google’s spam systems caused.
Should you keep publishing AI content after the spam update?
You should keep publishing content drafted with AI, as long as it’s high quality and helps the people reading it. Across our clients, the September update left content like that alone.
I think Google understands very well that more and more content is going to be created by AI, and that very soon even most high-quality content will be. Google wants that content in its index.
So you should be setting up systems right now to create high-quality content at scale with AI: a repeatable process where AI drafts the content and people review every piece before it goes live. That takes a lot more work than opening ChatGPT and asking it to write a blog post, but it’s well worth it. In my view, content marketing is by far the most effective form of marketing right now, and AI lets you publish far more of it while raising the quality (here’s how we approach it).
If you have questions about any of this, reach out through our contact page or email me at tj@tjrobertson.com.